Benckmark(NVIDIA Parabricks)
1. Overview
This page presents the results of detailed performance testing of the genome analysis tool, NVIDIA Parabricks (hereafter referred to as Parabricks), using hardware equipped with eight NVIDIA H100 SXM 80GB GPUs. The experiments conducted utilised typical whole-genome sequencing datasets commonly used in clinical research to evaluate both computational time and the validity of the output results. Our findings demonstrate that, compared to systems equipped with the previous V100 GPUs, systems with the NVIDIA H100 GPU can achieve a computational speed improvement of more than 2.3 times.
2. Verification GPU Environment
To compare the effective performance of the application, performance evaluations were conducted using nodes equipped with both H100 and V100 GPUs. The H100-equipped node used for verification was executed on a bare-metal server provided by Sakura Internet, featuring their high-performance PHY infrastructure (henceforth referred to as high-performance PHY), while the V100-equipped node was executed on the Thin computation node (Type 2b) of the NIG supercomputer system (henceforth referred to as NIG igt). Both environments were utilised as single-node configurations, with no application performance evaluations conducted on multi-node setups.
To avoid performance discrepancies due to differences in GPU drivers and other system configurations, the software environment settings from the NIG igt were adopted as verification conditions, and the same setup was replicated on the high-performance PHY.
The hardware and software environments of the nodes used for the verification are shown in Table 1.
Table 1: Verification Node Configuration
| NIG igt | High-Performance PHY | |
|---|---|---|
| Hardware Configuration | ||
| CPU (Total Cores) | Intel Xeon Gold 6136 3.0GHz x 2 (24 cores) | Intel Xeon Platinum 8480 2.0GHz x 2 (112 cores) |
| Memory | DDR4 384GB | DDR5 2.0TB |
| GPU (FP64) | NVIDIA V100 SXM2 16GB (7.8 TFlops) x 4 | NVIDIA H100 SXM5 80GB (33.5 Tflops) x 8 |
| GPU Interconnect | NVLink Hybrid Cube Mesh | NVSwitch Fabric |
| System Disk | NVMe SSD 1.6TB x 1 | NVMe SSD 960GB x 2 (RAID1 configuration) |
| Data Disk | NVMe SSD 3.2TB x 1 | NVMe SSD 7.68TB x 4 |
| Software Configuration | ||
| OS | Ubuntu Server 22.04 LTS | Ubuntu Server 22.04 LTS |
| GPU Driver | 530.30.02 | 530.30.02 |
| CUDA | 12.1 | 12.1 |
| Fabric Manager | N/A | UP |
| Singularity CE | 4.0.0 | 4.0.0 |
2.1 Hardware Configuration
In terms of basic configuration differences, the NIG igt uses CPUs with 24 cores and 384GB of DDR4 memory, whereas the high-performance PHY features 112 cores and 2TB of memory. Additionally, in terms of GPU, the NIG igt is equipped with 4 NVIDIA V100 SXM2 16GB GPUs (based on the Volta GV100 architecture) interconnected by NVLink Hybrid Cube Mesh. In contrast, the high-performance PHY is equipped with 8 NVIDIA H100 SXM5 80GB GPUs (based on the Hopper GH100 architecture), interconnected by NVSwitch, allowing for high-speed communication between the 8 GPUs.
2.2 Software Configuration
The software stack, including the OS distribution, GPU drivers, and management tools, was configured to match as closely as possible between the NIG igt and high-performance PHY environments. This was done to minimise any discrepancies, apart from those related to the application implementation itself.
Given that NIG igt is a managed cluster, changes to drivers that are closely tied to the OS environment can be complex. Thus, the high-performance PHY, being a bare-metal server with greater flexibility, was adapted to match the NIG igt software configuration.
The software environment was set up on the Singularity container platform, which is widely used in actual field research, ensuring consistency with real-world workflows.
2.3 Storage Environment
Dorado requires a storage environment capable of accommodating sufficiently large datasets with high-speed read and write capabilities. Both NIG igt and high-performance PHY feature high-speed NVMe SSDs in their local storage, which were used as storage areas for application input and output.
The storage configurations of the NIG igt and high-performance PHY nodes, along with I/O performance measurements from sequential fio commands, are shown in Table 2.
The /tmp directory, which is the measurement target, refers to the NVMe SSD on the system disk. At NIG igt, there was little difference in performance across the /data area. On the other hand, at high-performance PHY, there was a performance difference of approximately seven times.
Table 2: Storage Configuration and Sequential I/O Performance
| Measurement Target | READ | WRITE | |
|---|---|---|---|
| NIG igt | /tmp | 533MiB/s | 531MiB/s |
| /data | 607MiB/s | 605MiB/s | |
| high-performance PHY | /tmp | 145MiB/s | 153MiB/s |
| /data | 1052MiB/s | 1111MiB/s |
3. Genome Analysis Software
The NCGM WGSpipeline is a versatile workflow designed for variant detection from human whole-genome sequencing (WGS) data. The workflow includes various components such as mapping reads to a reference genome and performing variant calling from the mapped sequences. NCGM WGSpipeline uses NVIDIA’s Parabricks as the primary genome analysis software, which is over 10 times faster than the traditional CPU-based Genome Analysis Toolkit (GATK). Although FPGA-based accelerators have also been proposed, one of the advantages of Parabricks is its ability to leverage general-purpose GPUs, allowing for more flexible use of computational resources. To enhance the portability and availability of the workflow, NCGM WGSpipeline is implemented using the Common Workflow Language (CWL), enabling easy execution across different computing environments.
4. Performance Evaluation
Performance evaluations were conducted using the following versions of Parabricks with NCGM WGSpipeline on both high-performance PHY and NIG igt:
- v4.1.0
- v4.1.1
- v4.2.0
- v4.2.1
Both with and without the --low-memory option to limit GPU RAM usage were tested to evaluate computational time. For input data, 20 samples from the 1000 Genomes Project (NA18941, NA18945, NA18946, NA18952, NA18953, NA18957, NA18960, NA18964, NA18969, NA18971, NA18972, NA18976, NA18983, NA18988, NA18990, NA18991, NA18995, NA19001, NA19002, NA19006) were selected. During testing, errors occurred with samples NA18941 and NA18995 when using Parabricks v4.2.0 and v4.2.1, preventing the calculation of speed measurements for those samples. Therefore, the average computation time of the remaining 18 samples was compared.
Each sample's input data consisted of approximately 20 compressed FASTQ files, with total input data ranging from 43GB to 55GB in compressed form.
4.1 Analysis Time by Node and Version
The analysis times for each node and Parabricks version are shown in Table 3. In this performance evaluation, it was found that the analysis time did not differ significantly between versions of Parabricks on the same node. Additionally, since NIG igt has a GPU RAM capacity of 16GB, it was impossible to run the analysis without the --low-memory option, and thus only results with the --low-memory option are provided for NIG igt. Comparing the results with the --low-memory option, it was observed that high-performance PHY completed the analysis more than 2.3 times faster than NIG igt. Factors such as GPU performance and the number of GPUs may have contributed to the speed difference, but it was not possible to determine the dominant factor in this evaluation.
Table 3: Comparison of Analysis Speed by Node and Parabricks Version
| GPU | Parabricks Version | Analysis Time (min) w/ low memory | Analysis Time (min) w/o low memory |
|---|---|---|---|
| High-performance PHY | v4.1.0 | 37.65 | 38.42 |
| (H100x8) | v4.1.1 | 38.15 | 37.93 |
| v4.2.0 | 36.17 | 36.78 | |
| v4.2.1 | 37.87 | 36.38 | |
| NIG igt | v4.1.0 | 88.00 | - |
| (V100x4) | v4.1.1 | 88.42 | - |
| v4.2.0 | 89.13 | - | |
| v4.2.1 | 90.05 | - |
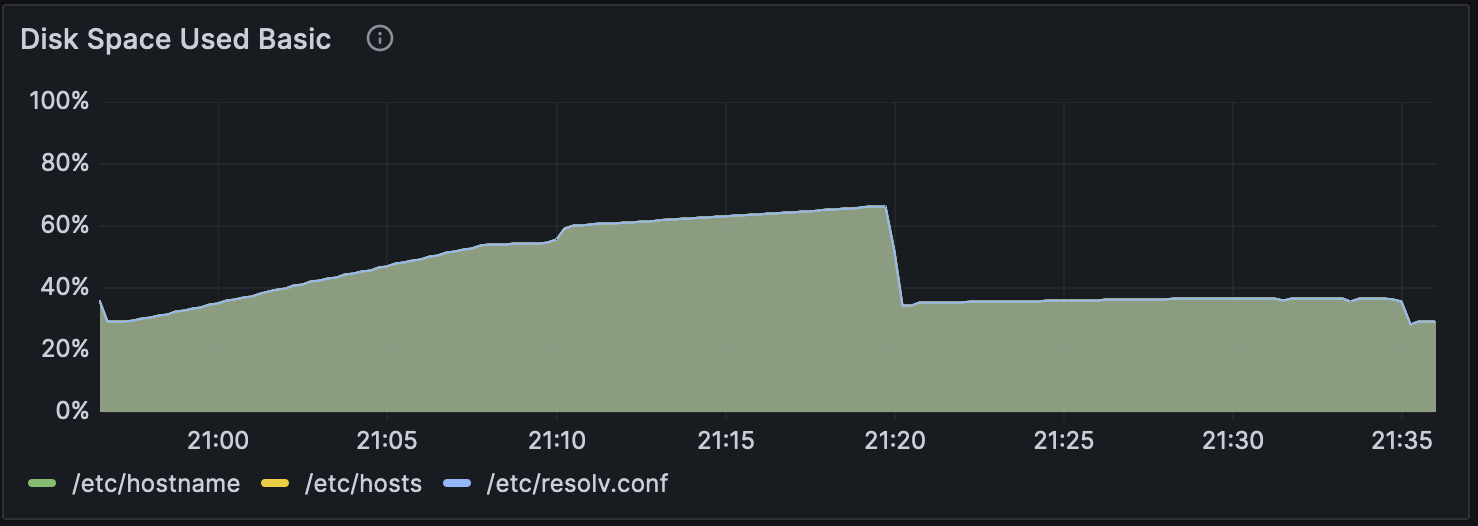
Additionally, the GPU usage during Parabricks v4.2.1 with the --low-memory option for the high-performance PHY system is shown in Figure 1. CPU usage is shown in Figure 2, and disk usage in Figure 3.
The analysis starts with the mapping process, and from around 21:10, variant calling begins. During the mapping process, the GPU utilization is not fully efficient, likely because the compression and writing of files are happening concurrently. Also, only a few CPU cores are being utilized during the mapping and subsequent processing, which could either be due to algorithmic constraints or an implementation/option issue, which will need further investigation.
In the NCGM WGSpipeline, five different types of variant calls are performed. From 21:21 to 21:30, the variant calling on autosomes takes more time than the others, with all other variant calls finishing in under a minute. This suggests that autosomal variant calling takes significantly more time than the others. Furthermore, GPU and CPU usage during variant calling do not show any significant increase in usage, indicating that only a portion of the GPU and CPU cores are being utilized.
Figure 1: GPU Usage During Parabricks Analysis on High-performance PHY
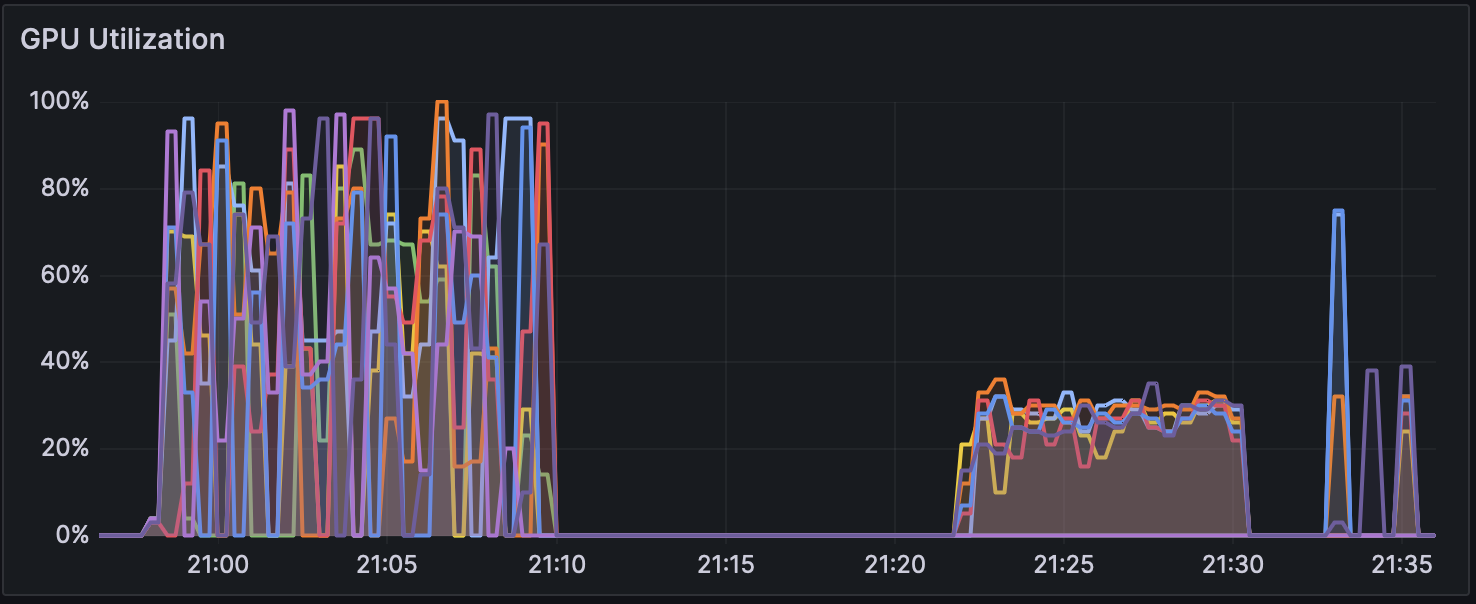
Figure 2: CPU Usage During Parabricks Analysis on High-performance PHY
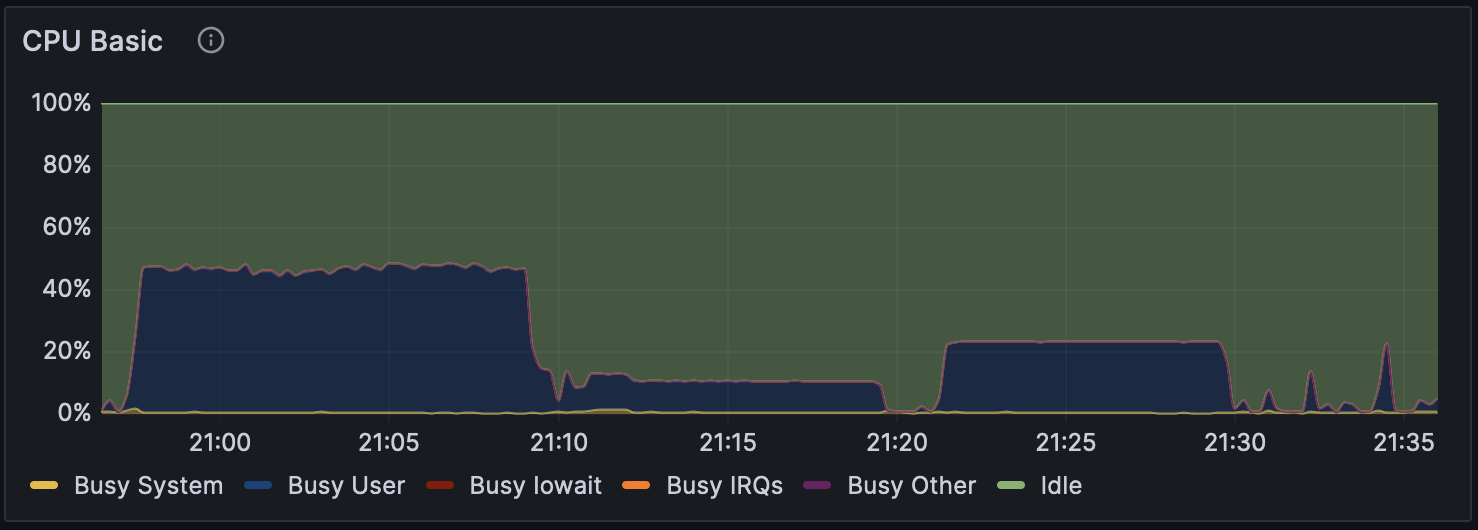
Figure 3: Disk Usage During Parabricks Analysis on High-performance PHY
4.2 Validity of the Analysis Results
Table 4 shows the genotype concordance rates for variant detection between the calculation results of Parabricks v4.0.0 and the versions evaluated in this study. The concordance rate was calculated by distinguishing between SNP (single nucleotide polymorphisms) and INDEL (insertions and deletions). The results from v4.1.0 and v4.1.1 completely matched those of v4.0.0. While the results from v4.2.0 and v4.2.1 did not perfectly match v4.0.0, they showed very high concordance and were almost identical. Versions v4.0.0, v4.1.0, and v4.1.1 were implemented to be compatible with GATK v4.2.0.0, while v4.2.0 and v4.2.1 were implemented to be compatible with GATK v4.3.0.0. This difference in GATK version compatibility is thought to be the reason for the slight mismatch in results between v4.0.0 and v4.2.0/v4.2.1. Overall, the analysis results from all versions showed very high concordance with those from Parabricks v4.0.0, suggesting the validity of the results.
Table 4: Genotype Concordance Between Parabricks v4.0.0 and Evaluated Parabricks Versions by Variant Type
| v4.1.0 | v4.1.1 | v4.2.0 | v4.2.1 | |
|---|---|---|---|---|
| SNP | 1.0000000 | 1.0000000 | 0.9999979 | 0.9999979 |
| INDEL | 1.0000000 | 1.0000000 | 0.9999932 | 0.9999932 |
5. Conclusion
This study demonstrates that the use of computing nodes equipped with the latest H100 GPUs can significantly accelerate genome analysis using Dorado. However, the limited period during which the High-Performance PHY was available left some aspects unresolved, and further investigations are planned in collaboration with relevant parties.
6. About this Article
The findings presented here were generated based on measurements conducted in the fiscal year 2023 as part of the joint research project "Research on the Lifecycle Design of Large-Scale Research Data" (2020–) between the National Institute of Genetics (NIG) DDBJ Centre and Sakura Internet Inc.
7. Article Details and Related Link
Article Creation Date: 6th June 2024
7.1 Project Members
- Tomoya Tanjo1, 2
- Shun Nogawa3
- Kentaro Yamamoto3
- Manabu Ishii3
- Tatsuro Ohta1, 4
- Fumikazu Konishi5
- Tsuyoshi Hachiya3
- Osamu Ogasawara1
1: National Institute of Genetics, Bioinformation and DDBJ Center
2: Joint Support-Center for Data Science Research, BioData Science Initiative
3: Genome Analytics Japan Inc.
4: Chiba University, Institute for Adovanced Academic Research
5: Sakura Internet Inc.