 The NIG Supercomputer
Statistics
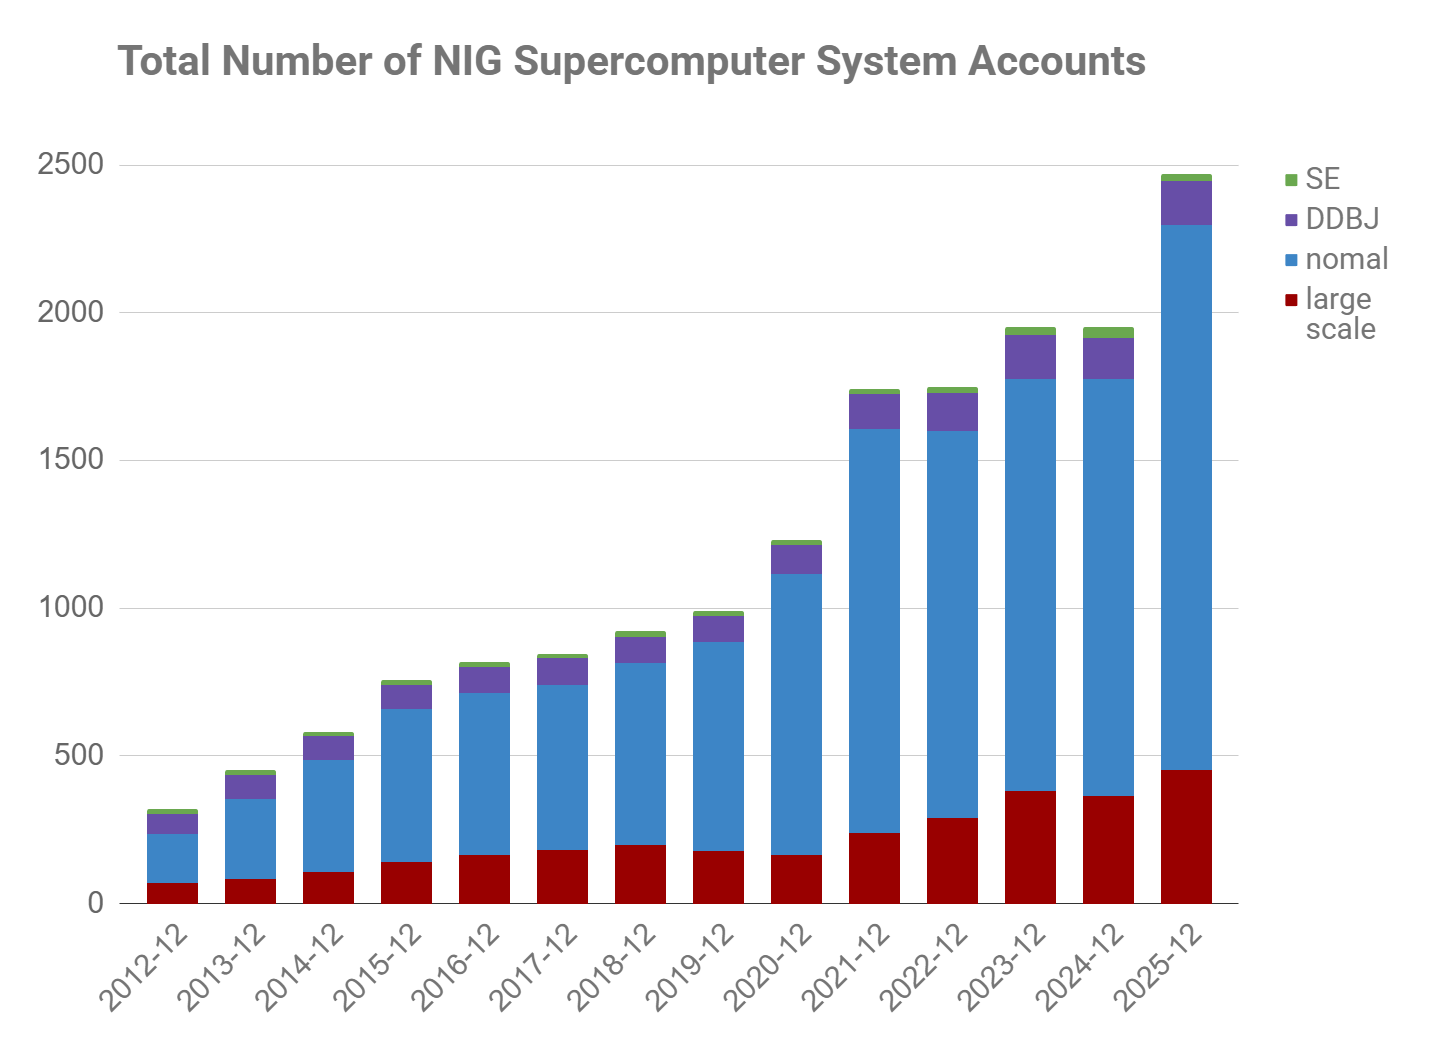
Number of users
| Aggregate date | login user (normal) | login user (large scale) | DDBJ | SE | Total |
|---|---|---|---|---|---|
| 12-31-2012 | 165 | 69 | 70 | 16 | 320 |
| 12-31-2013 | 270 | 84 | 80 | 19 | 453 |
| 12-31-2014 | 380 | 105 | 82 | 13 | 580 |
| 12-31-2015 | 519 | 139 | 83 | 15 | 756 |
| 12-31-2016 | 549 | 165 | 88 | 14 | 816 |
| 12-31-2017 | 557 | 182 | 92 | 15 | 846 |
| 12-31-2018 | 616 | 199 | 88 | 18 | 921 |
| 12-31-2019 | 706 | 178 | 91 | 15 | 990 |
| 12-31-2020 | 949 | 165 | 100 | 17 | 1231 |
| 12-31-2021 | 1365 | 240 | 119 | 19 | 1662 |
| 12-31-2022 | 1310 | 290 | 128 | 20 | 1748 |
| 12-31-2023 | 1394 | 381 | 151 | 27 | 1953 |
| 12-31-2024 | 1413 | 364 | 139 | 36 | 1952 |
| 12-31-2025 | 1845 | 451 | 149 | 24 | 2469 |
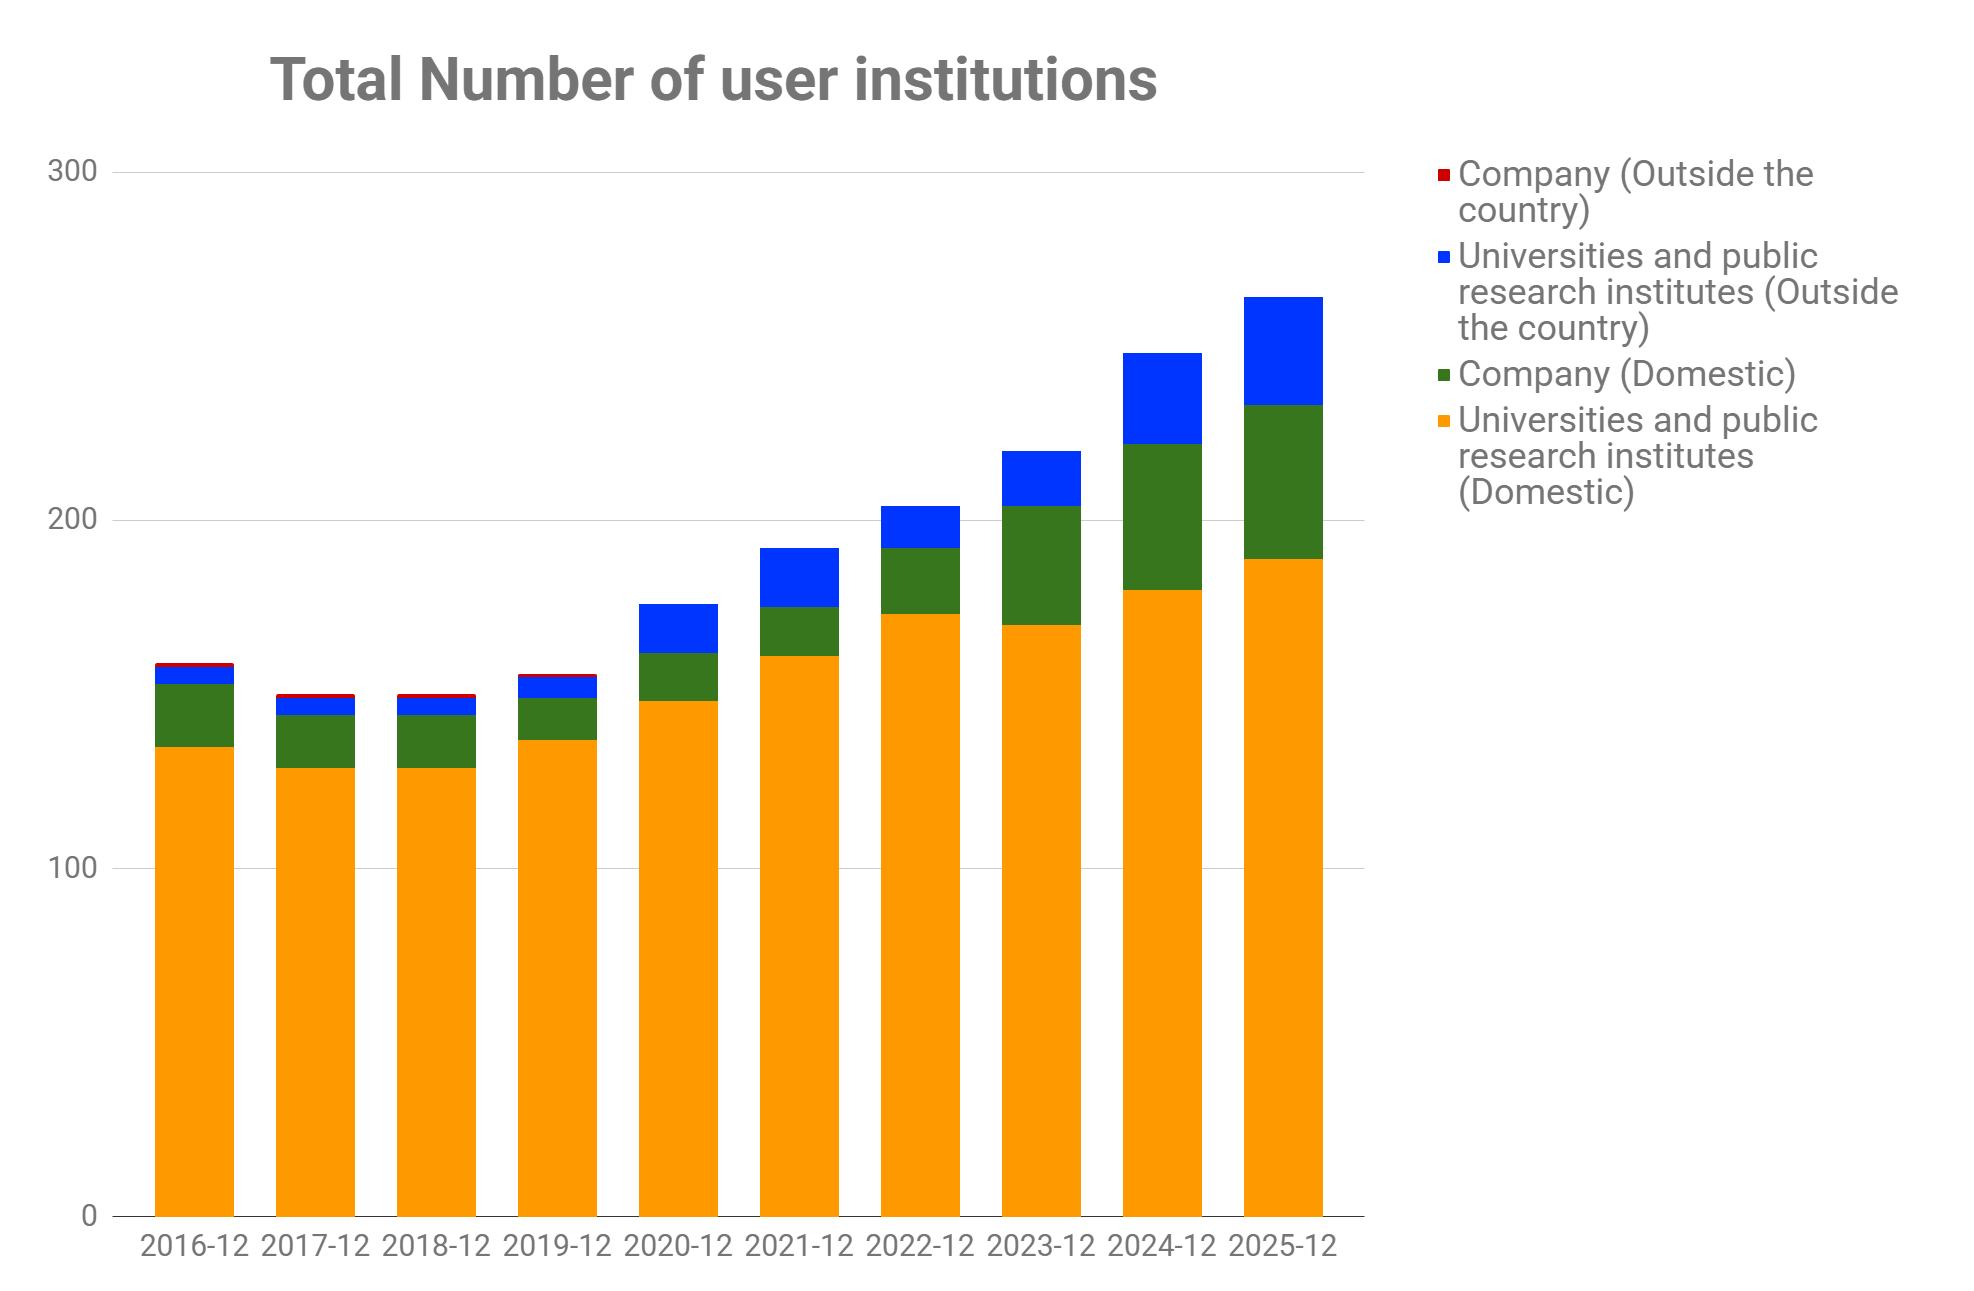
Number of institutions
The number of institutions applying for Grants-in-Aid for Scientific Research was counted as one institution. (In the case of non-applicant institutions for Grants-in-Aid for Scientific Research, universities, companies, etc. were counted as one institution. Companies are not disclosed). For specific institution names, see 'Number of accounts by institution'. Aggregated only for universities and public research institutions (companies are not dixcclosed).
| Aggregate date | Domestic | Outside the country | Total | ||||
|---|---|---|---|---|---|---|---|
| Universities and public research institutes | company | Total | Universities and public research institutes | company | Total | ||
| 12-31-2016 | 135 | 18 | 153 | 5 | 1 | 6 | 159 |
| 12-31-2017 | 129 | 15 | 144 | 5 | 1 | 6 | 150 |
| 12-31-2018 | 129 | 15 | 144 | 5 | 1 | 6 | 150 |
| 12-31-2019 | 137 | 12 | 149 | 6 | 1 | 7 | 156 |
| 12-31-2020 | 148 | 14 | 162 | 14 | 0 | 14 | 176 |
| 12-31-2021 | 161 | 14 | 175 | 17 | 0 | 17 | 192 |
| 12-31-2022 | 173 | 19 | 192 | 12 | 0 | 12 | 204 |
| 12-31-2023 | 170 | 34 | 204 | 16 | 0 | 16 | 220 |
| 12-31-2024 | 180 | 42 | 222 | 26 | 0 | 26 | 248 |
| 12-31-2025 | 189 | 44 | 233 | 31 | 0 | 31 | 264 |
Number of peer-reviewed papers published
Aggregation period: January 1st -- December 31st
| Journal published year | Number of papers compiled at each end-of-year renewal | Number of additional papers submitted after the end-of-year renewal tally for each year | Total |
|---|---|---|---|
| 2012 | 9 | 0 | 9 |
| 2013 | 23 | 0 | 23 |
| 2014 | 53 | 0 | 53 |
| 2015 | 43 | 0 | 43 |
| 2016 | 83 | 0 | 83 |
| 2017 | 93 | 0 | 93 |
| 2018 | 113 | 0 | 113 |
| 2019 | 104 | 1 | 105 |
| 2020 | 124 | 1 | 125 |
| 2021 | 167 | 13 | 180 |
| 2022 | 177 | 7 | 184 |
| 2023 | 203 | 0 | 203 |
