Power consumption of the NIG supercomputer
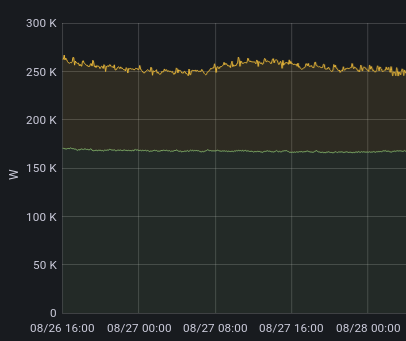
This graph shows the power consumption of the NIG supercomputer.
- Top (yellow): Cooling System
- Bottom (green): IT Equipments
You can see a graph of power consumption for the past week by clicking the link below.
Click on the links below to view graphs on power consumption for the last week and year.
You can see power consumption graphs for the last week and year by clicking on the links below.