Waiting time until starting execution
In the line graph below, queueing time is the waiting time until starting execution.
- The waiting time until starting execution is estimated by dividing the amount of jobs in the queue by the amount of jobs processed in an hour.
- The amount of jobs in the queue is shown in blue on the bar graph.
- The amount of jobs processed per hour is calculated from the 12-hour average of the vertical axis of the line graph (the amount of jobs processed in 10 minutes) multiplied by 6.
The quantity of jobs is calculated as the number of slots occupied by jobs.
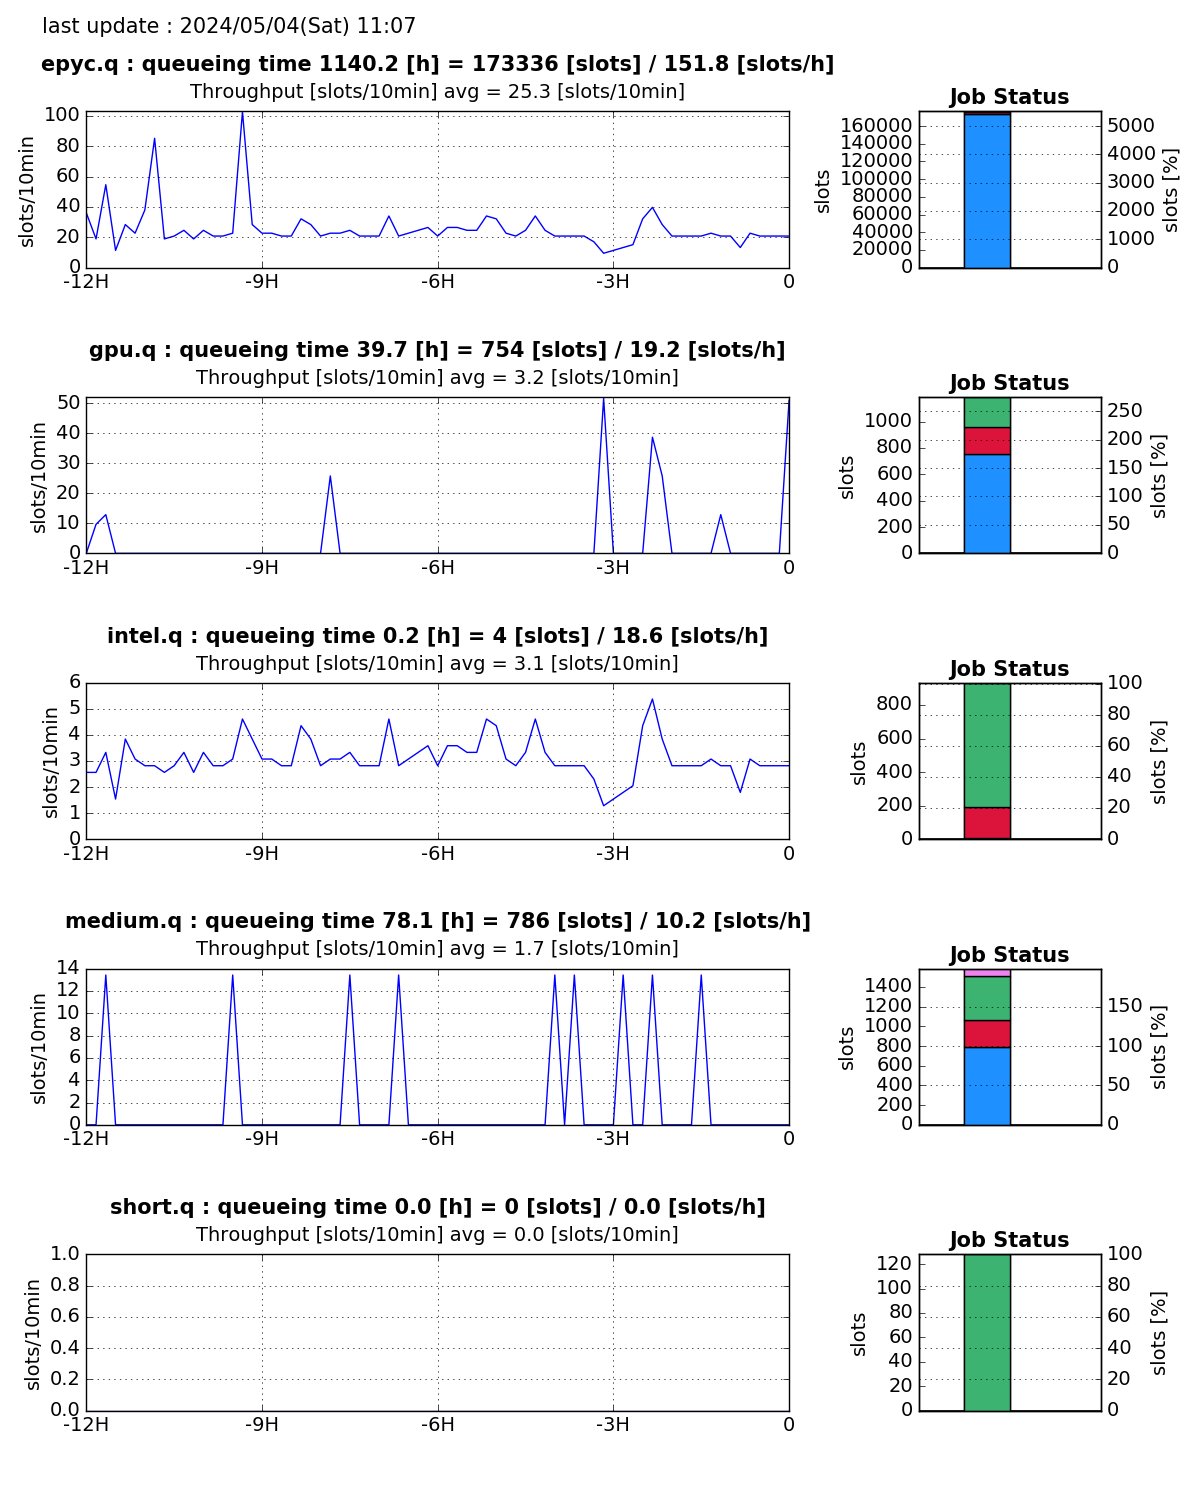
- Left (the line graph): The amount of jobs per hour that have started running out of the jobs waiting in the queue.
- Right (the bar chart)
- Red: amount of jobs currently running
- Blue: amount of waiting in the queue
- Green: amount of free resources
- Pink: amount of jobs in error state
The data is updated every 10 minutes.
Reference
Job definition
Refere to the "Grid Engine Overview" page.
Queue definition
Refere to the "Grid Engine Queue Type" page.
Slot definition
| Compute node type | Definition of 1 slot |
|---|---|
| Thin Type 1a | 1 CPU core, 8GB memory |
| Thin Type 1b | 1 CPU core, 4GB memory |
| Thin Type 2a | 1 CPU core, 12GB memory |
| Thin Type 2b | 1 CPU core, 16GB memory |
| Medium | 1 CPU core, 38.4GB memory |
| Fat | 1 CPU core, 47.2GB memory |
The number of slots consumed by a job is calculated based on the number of CPU cores requested or the amount of memory, whichever is greater.
Example:
- A job requesting 3 CPU cores and 2 GB memory will request 3 slots.
- If one CPU core, 12 GB memory is requested in the AMD queue (Thin Type 1a) of the general analysis division, the number of slots requested is calculated to be 2.