Statistics
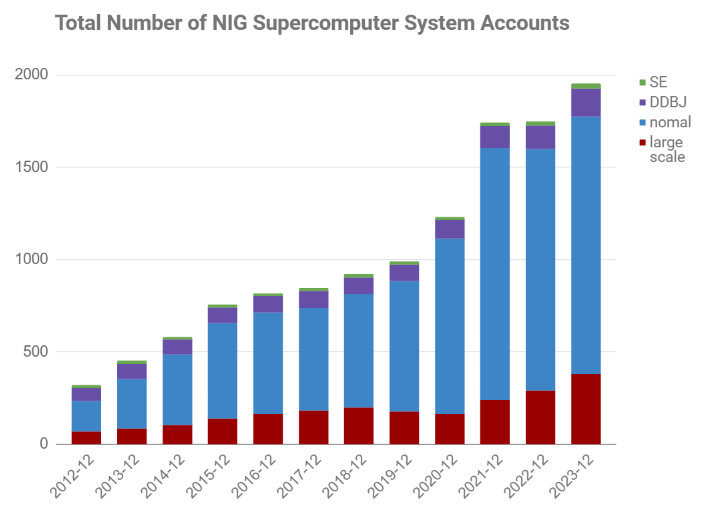
Number of users
| Aggregate date | login user (normal) | login user (large scale) | DDBJ | SE | Total |
|---|---|---|---|---|---|
| 12-31-2012 | 165 | 69 | 70 | 16 | 320 |
| 12-31-2013 | 270 | 84 | 80 | 19 | 453 |
| 12-31-2014 | 380 | 105 | 82 | 13 | 580 |
| 12-31-2015 | 519 | 139 | 83 | 15 | 756 |
| 12-31-2016 | 549 | 165 | 88 | 14 | 816 |
| 12-31-2017 | 557 | 182 | 92 | 15 | 846 |
| 12-31-2018 | 616 | 199 | 88 | 18 | 921 |
| 12-31-2019 | 706 | 178 | 91 | 15 | 990 |
| 12-31-2020 | 949 | 165 | 100 | 17 | 1231 |
| 12-31-2021 | 1365 | 240 | 119 | 19 | 1662 |
| 12-31-2022 | 1310 | 290 | 128 | 20 | 1748 |
| 12-31-2023 | 1394 | 381 | 151 | 27 | 1953 |
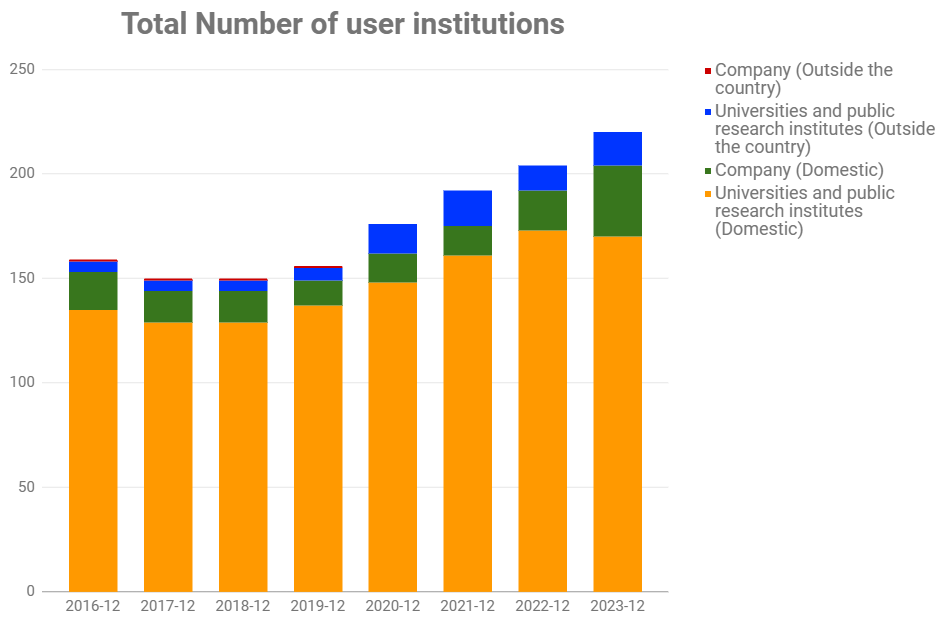
Number of user institutions
The number of institutions represents the number of institutions applying for scientific research funding in Japan.
| Aggregate date | Domestic | Outside the country | Total | ||||
|---|---|---|---|---|---|---|---|
| Universities and public research institutes | company | Total | Universities and public research institutes | company | Total | ||
| 12-31-2016 | 135 | 18 | 153 | 5 | 1 | 6 | 159 |
| 12-31-2017 | 129 | 15 | 144 | 5 | 1 | 6 | 150 |
| 12-31-2018 | 129 | 15 | 144 | 5 | 1 | 6 | 150 |
| 12-31-2019 | 137 | 12 | 149 | 6 | 1 | 7 | 156 |
| 12-31-2020 | 148 | 14 | 162 | 14 | 0 | 14 | 176 |
| 12-31-2021 | 161 | 14 | 175 | 17 | 0 | 17 | 192 |
| 12-31-2022 | 173 | 19 | 192 | 12 | 0 | 12 | 204 |
| 12-31-2023 | 170 | 34 | 204 | 16 | 0 | 16 | 220 |
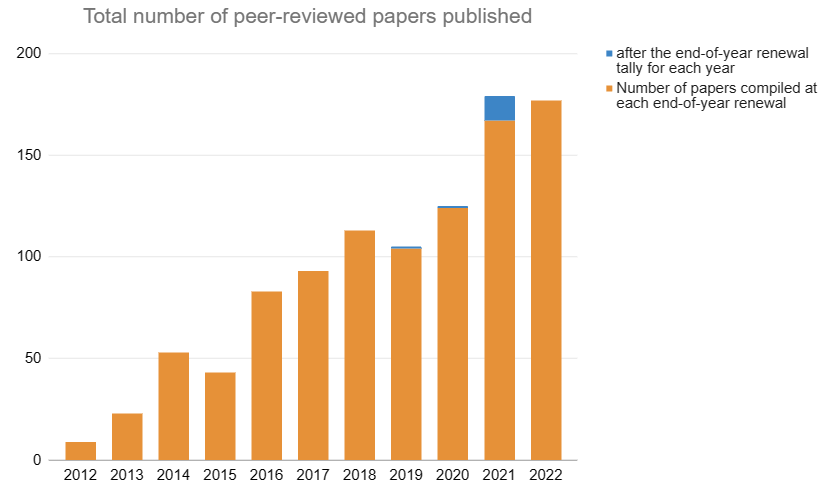
Number of peer-reviewed papers published
Aggregation period: January 1st -- December 31st
| Journal published year | Number of papers compiled at each end-of-year renewal | Number of additional papers submitted after the end-of-year renewal tally for each year | Total |
|---|---|---|---|
| 2012 | 9 | 0 | 9 |
| 2013 | 23 | 0 | 23 |
| 2014 | 53 | 0 | 53 |
| 2015 | 43 | 0 | 43 |
| 2016 | 83 | 0 | 83 |
| 2017 | 93 | 0 | 93 |
| 2018 | 113 | 0 | 113 |
| 2019 | 104 | 1 | 105 |
| 2020 | 124 | 1 | 125 |
| 2021 | 167 | 12 | 179 |
| 2022 | 177 | 0 | 177 |