Profiler
Intel Advisor
Intel Advisor is a high-performance vectorization and threading optimization tool for C, C++, C#, and Fortran software developers. It helps to efficiently and safely vectorize your code by identifying parts that can be parallelized. It is installed in the following directory on the NIG supercomputer:
/lustre7/software/intel_ubuntu/oneapi/advisor/2023.2.0/bin64/advisor
For more information, visit the following links:
| Command | Description |
|---|---|
| advisor | CLI version of Advisor |
| advisor-gui | GUI version of Advisor |
To use Advisor on the NIG supercomputer, you typically submit a performance evaluation job to a compute node as a batch job and then analyze the results on a login node using Advisor. The following explains this process step by step.
Compiling the Executable
To collect evaluation information, you need to compile your program with the -g option.
icpx source_filename -g
Obtaining Analysis Information
Use the advisor command-line tool to gather analysis information. The example below uses a sample program named vec_samples.
(base) yxxxx@at137:~/advisor/vec_samples$ advisor --collect=survey --project-dir=./results -- ./vec_samples
Intel(R) Advisor Command Line Tool
Copyright (C) 2009-2023 Intel Corporation. All rights reserved.
advisor: Collection started. To stop the collection, either press CTRL-C or enter from another console window: advisor -r /lustre7/home/yxxxx/advisor/vec_samples/results/e000/hs000 -command stop.
ROW:47 COL: 47
Execution time is 2.936 seconds
GigaFlops = 1.504849
Sum of result = 254364.540283
advisor: Collection stopped.
advisor: Opening result 99 % done
advisor: Preparing frequently used data 0 % done
advisor: Preparing frequently used data 100 % done
advisor: Warning: Higher instruction set architecture (ISA) available
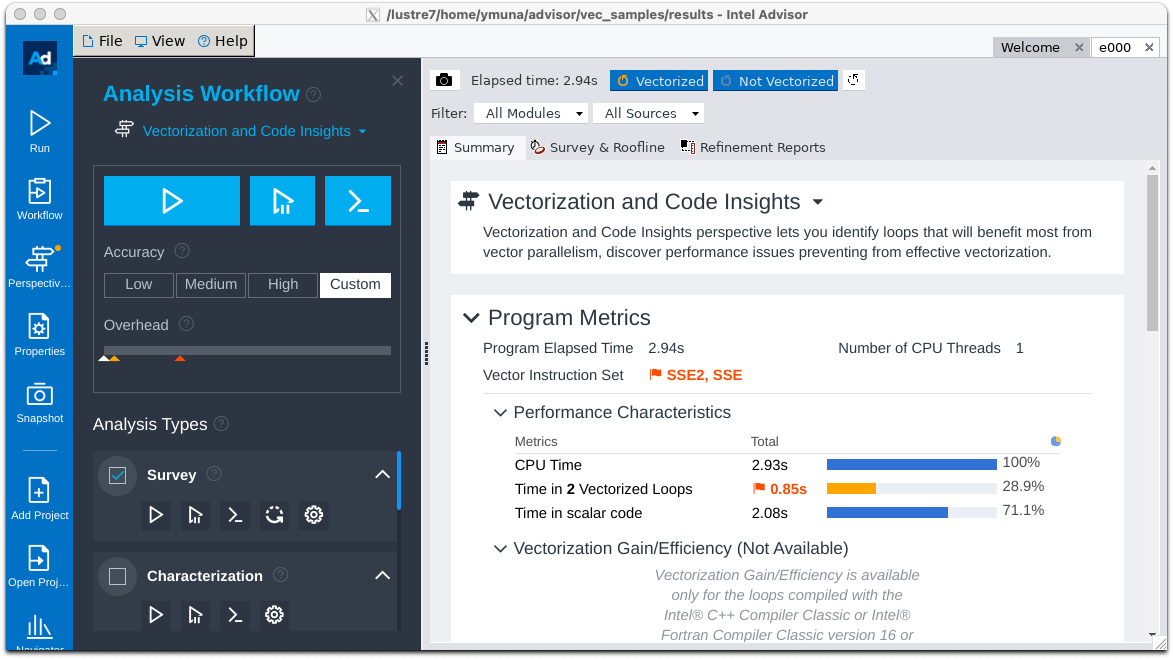
Program Elapsed Time: 2.94s
CPU Time: 2.94s
Time in 2 Vectorized Loops: 0.85s
In the above process, analysis information is stored in the ./results directory.
Checking Analysis Results via CLI
You can output the report file via CLI with the following command line specification.
advisor -report survey -project-dir ./result -format=text -report-output ./result/report.txt
The contents of report.txt will look something like this. You can add more content to the report by specifying additional options.
Intel(R) Advisor Command Line Tool
Copyright (C) 2009-2023 Intel Corporation. All rights reserved.
Survey Data version="1.1.0"

ID     Function Call Sites and Loops      Total Time   Self Time          Type           Why No Vectorization   Vector ISA   Compiler Estimated Gain   Transformations   Source Location     Module
_________________________________________________________________________________________________________________________________________________________________________________________________________
 4   [loop in matvec at Multiply.c:69]        2.122s      2.122s                Scalar                                                                                     Multiply.c:69   vec_samples
 9   [loop in matvec at Multiply.c:82]        0.710s      0.710s   Vectorized Versions                                 SSE                                                 Multiply.c:82   vec_samples
 7   -[loop in matvec at Multiply.c:82]       0.566s      0.566s     Vectorized (Body)                                 SSE                                                 Multiply.c:82   vec_samples
 2   -[loop in matvec at Multiply.c:82]       0.144s      0.144s                Scalar                                                                                     Multiply.c:82   vec_samples
 3   [loop in matvec at Multiply.c:49]        3.448s      0.392s                Scalar                                                                                     Multiply.c:49   vec_samples
 8   [loop in matvec at Multiply.c:60]        0.224s      0.224s   Vectorized Versions                                 SSE                                                 Multiply.c:60   vec_samples
 6   -[loop in matvec at Multiply.c:60]       0.196s      0.196s     Vectorized (Body)                                 SSE                                                 Multiply.c:60   vec_samples
 5   -[loop in matvec at Multiply.c:60]       0.028s      0.028s                Scalar                                                                                     Multiply.c:60   vec_samples
 1   [loop in main at Driver.c:155]           3.460s          0s                Scalar                                                                                      Driver.c:155   vec_samples
Checking Analysis Results via GUI
To launch and view results with the GUI version of Advisor, you need an X server environment set up on your local PC.
First, log in to the interactive node where you want to launch Advisor using qlogin, and note the host name.
Next, set up an SSH tunnel for X forwarding. Log in to the gateway node with the -CX option from your local terminal:
ssh -l username -CX gw.ddbj.nig.ac.jp
Then, log in to the node where Advisor is running with the -CX option:
ssh -CX login_node_name
Check the DISPLAY environment variable:
$ echo $DISPLAY
localhost:13.0
Keep this terminal open during your work. It's only used for setting up the SSH tunnel. Further operations should be done from another terminal where you logged in using qlogin.
Set the DISPLAY environment variable on the terminal where you logged in using qlogin:
export DISPLAY= localhost:13.0
echo $DISPLAY
localhost:13.0
Launch Advisor. Here, the argument specifies the directory where the analysis information is stored:
advisor-gui ./results
The following screen will appear on your local PC:
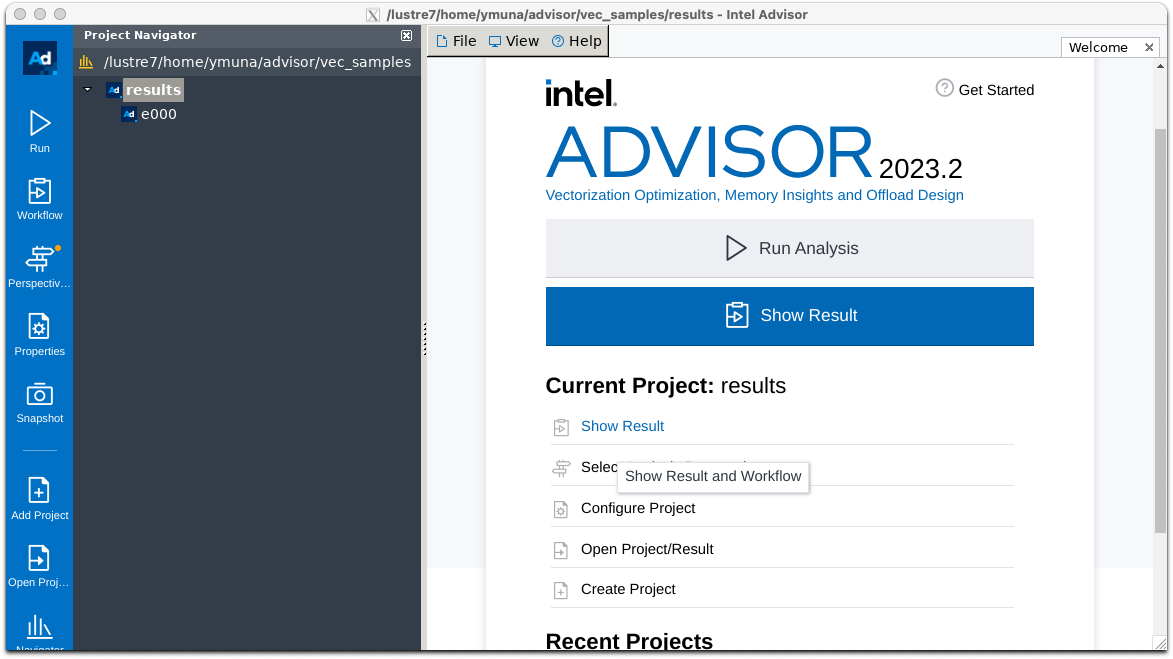
Click the "show result" button. After a while, the result display screen will appear as shown below:
For how to use the profiler, please refer to the user guide.
Intel VTune Profiler
A performance analysis tool.
- Product page by the distributor
- Intel's User Guide (English)
- Performance Analysis Cookbook translated by the distributor
Here, we describe how to use VTune with a web server (vtune-backend) version, starting vtune-backend on a login node and connecting from a user PC. The following description refers to the article by Intel:
First, on an interactive node logged in via qlogin, start vtune-backend.
vtune-backend --web-port=40507 --enable-server-profiling --data-directory=~/vtune-data --reset-passphrase
No TLS certificate was provided as a --tls-certificate command-line argument thus a self-signed certificate is generated to enable secure HTTPS transport for the web server: /home/yxxxx/.intel/vtune/settings/certificates/middleware.crt.
VTune Profiler GUI is accessible via https://127.0.0.1:40507/?one-time-token=c623b26caf9c08c12cf448c03ebb0a29
The options used for vtune-backend are as follows:
--web-portSpecifies the port number to launch vtune-backend. Here, 40507 is used as an example.--enable-server-profilingEnables server profiling. Always use this option.--data-directorySpecifies the directory where the data files used for profiling are located.--reset-passphraseRequires a passphrase to access the web interface. At the first access, you will be asked to set a passphrase.
Next, create an SSH tunnel using SSH port forwarding. Enter the following command in your local PC's terminal to login to the gateway node.
ssh -L 127.0.0.1:40507:127.0.0.1:40507 gw.ddbj.nig.ac.jp
Then, from the gateway node, SSH to the login node where vtune-backend is running.
ssh -L 127.0.0.1:40507:127.0.0.1:40507 login_node_name
Keep the terminal opened where you made this SSH connection. Closing the terminal will also end the SSH tunnel. For operations on the login node, please login using qlogin. This step is only performed to establish the SSH tunnel and should not be used for any other operations.
Launch a browser on your PC and go to:
http://127.0.0.1:40507
Then, add the one-time token displayed in the above screen
?one-time-token=c623b26caf9c08c12cf448c03ebb0a29
to the URL:
http://127.0.0.1:40507/?one-time-token=c623b26caf9c08c12cf448c03ebb0a29
This will display the following screen.
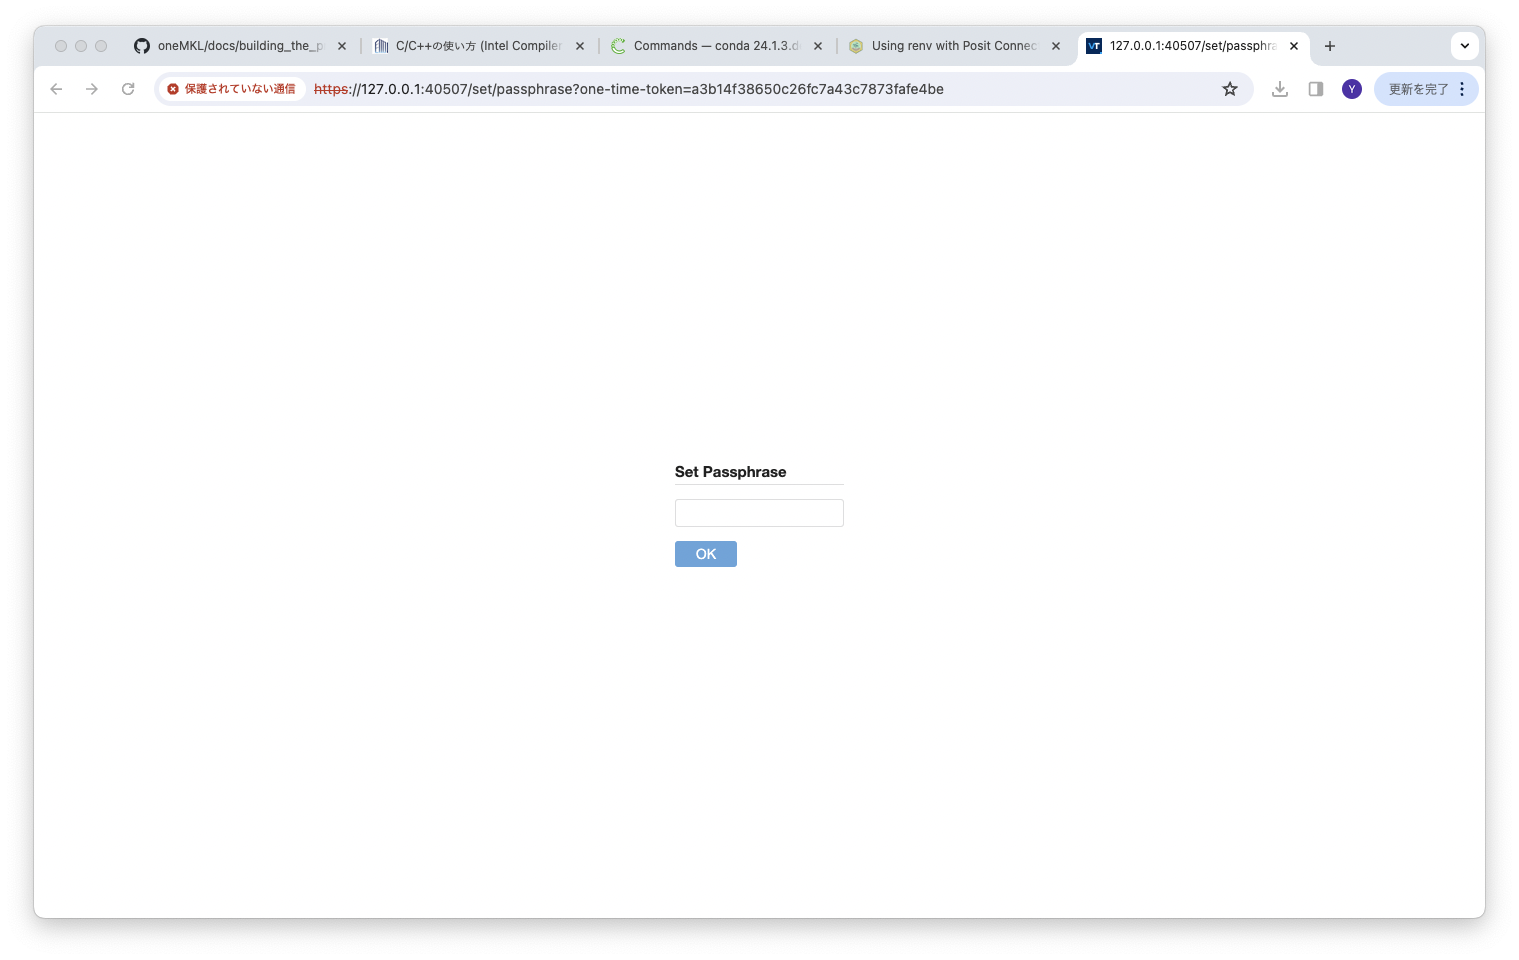
You're requested to register a passphrase to access the profiler. After registering a passphrase of your choice, you will see the profiler's interface as below.
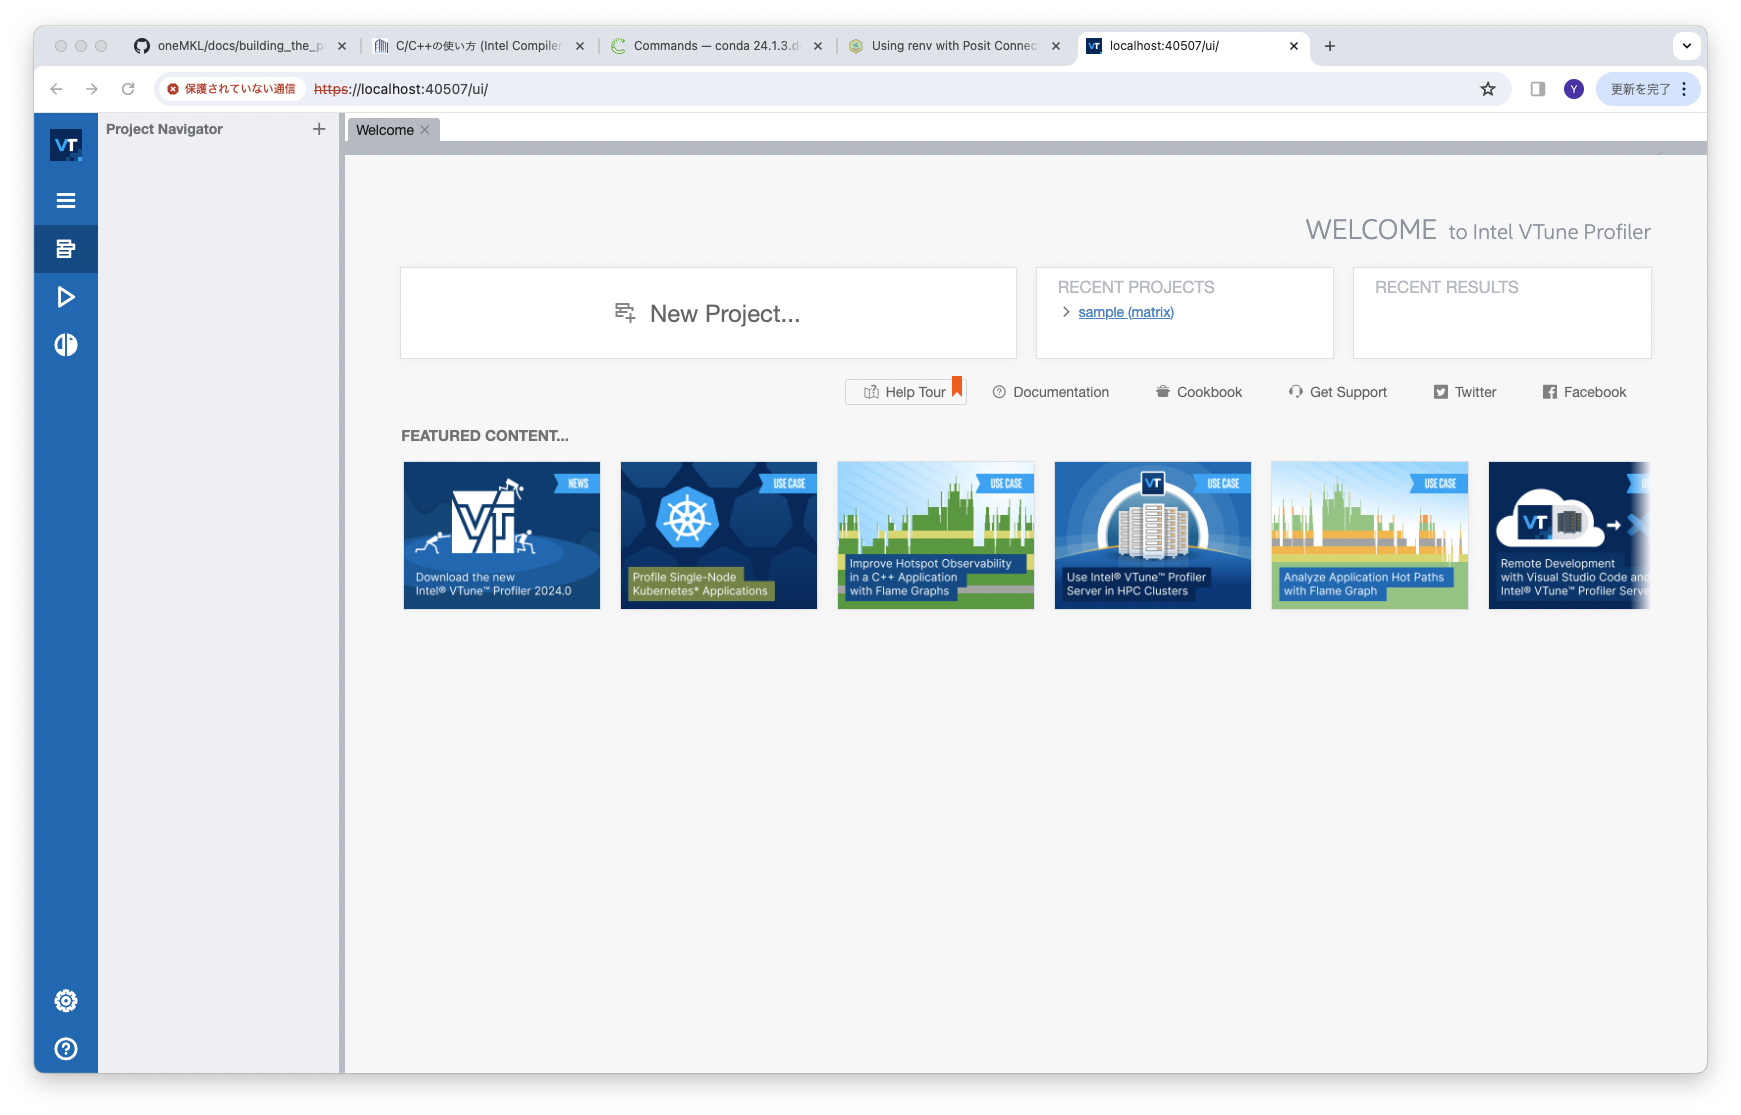
Refer to the user guide for how to use the profiler.
Intel Trace Analyzer & Collector
A performance analysis and tuning tool for MPI applications. It is used in conjunction with the Intel MPI Library to perform performance analysis and tuning based on trace information.
| Command | Description |
|---|---|
| traceanalyzer | Trace Analyzer GUI version |
The basic usage involves running the
program with the -trace option on the mpirun command during execution to capture MPI trace information into a trace file, then analyzing the trace file with traceanalyzer.
Include the following command in your batch script to launch the job. Ensure that mpirun is from Intel MPI.
mpirun -trace your_program
After execution, a file named your_program_name.stf is created, which you load and analyze.
CLI method for trace checking
You can generate a report file with the following command.
traceanalyzer --cli -o report.txt --messageprofile stf file name
GUI method for trace checking
Since the traceanalyzer GUI is an X application, set up SSH X port forwarding before running:
traceanalyzer
This action displays the following screen.
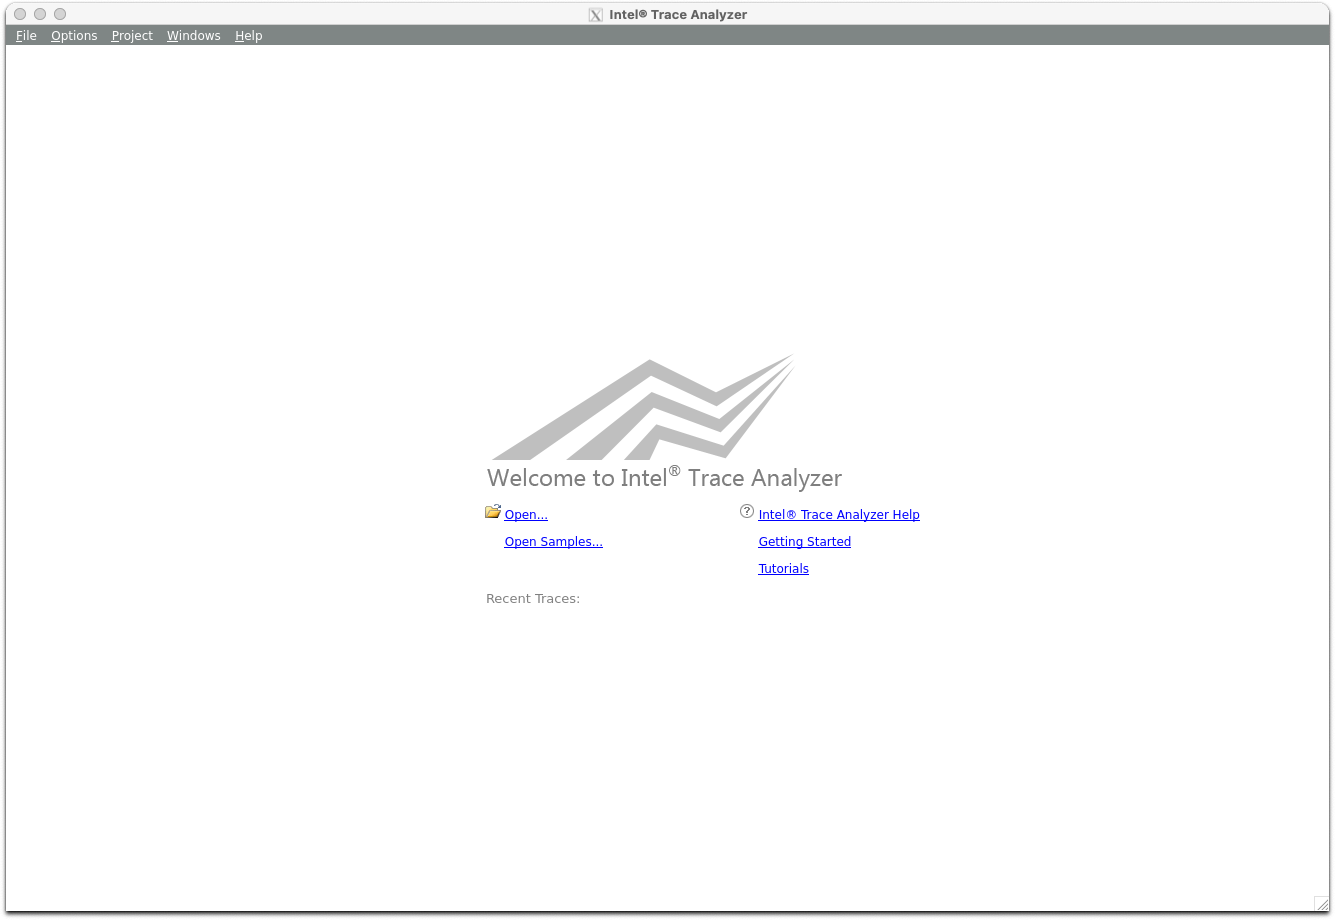
In this screen, select Open from the File menu to load the stf file for analysis. This allows you to check the MPI communication pattern.
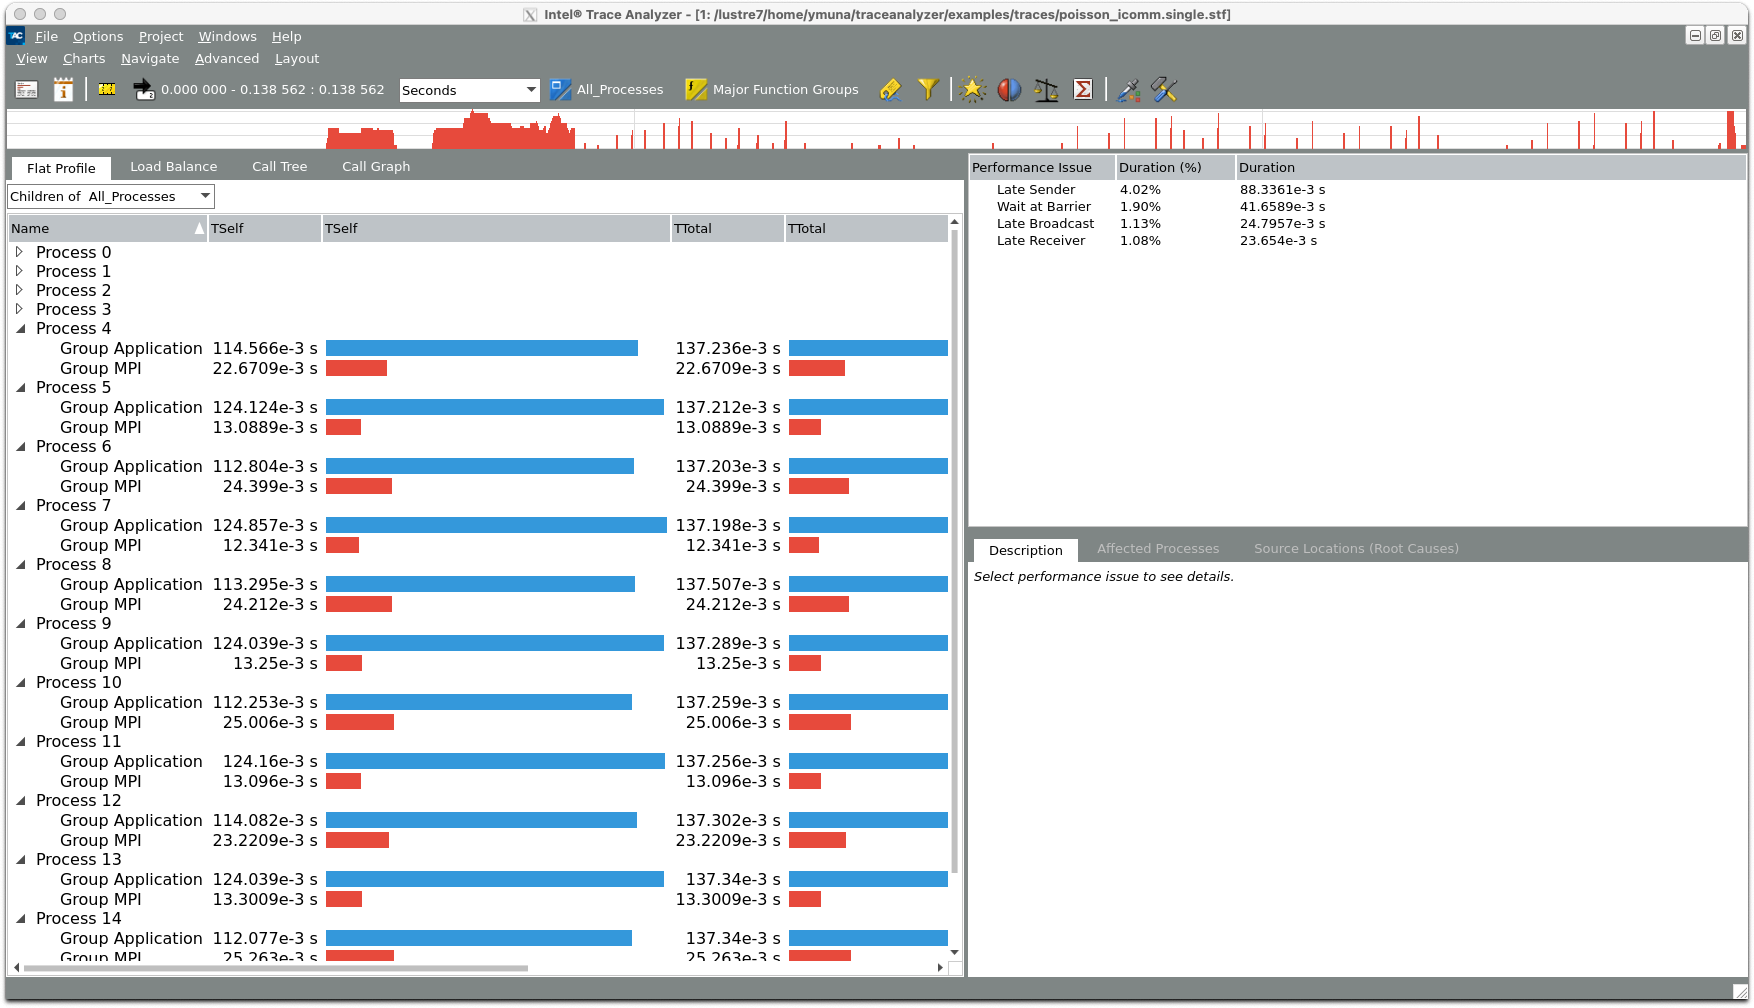
For detailed usage, please refer to the Intel website mentioned above.