Debugger
Intel Distribution for GDB
A version of GDB that includes additional features for debugging on Intel CPUs, GPUs, and FPGAs compared to standard GDB.
| Command | Description |
|---|---|
| gdb-oneapi | oneapi's gdb |
Intel Inspector
A debugger for memory/threading issues. It facilitates the detection of memory errors and threading errors in C, C++, and Fortran applications.
- Product page by the distributor
- Intel product page
- Inspector user guide (English)
- Command-line syntax
| Command | Description |
|---|---|
| inspxe-cl | CLI version of the Inspector |
| inspxe-gui | GUI version of the Inspector |
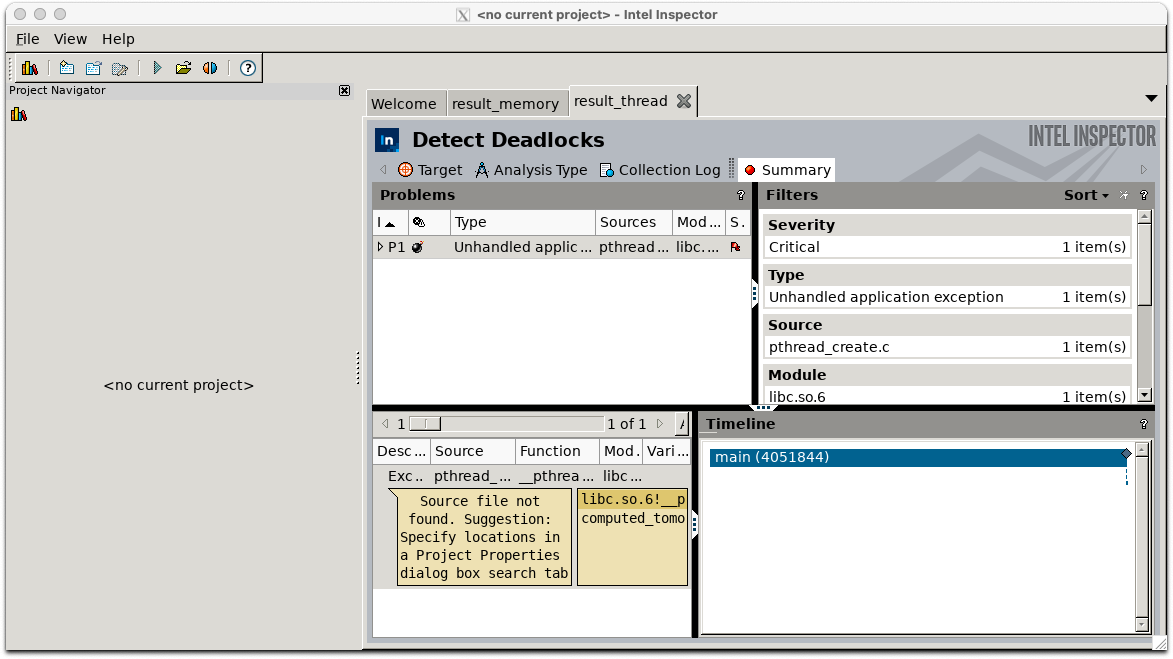
In the supercomputer at the genetics research institute, the usage involves executing as a batch job on compute nodes to collect information, then analyzing the collected result files on the login node.
source /lustre7/software/intel_ubuntu/oneapi/inspector/2024.0/inspxe-vars.sh
inspxe-cl -collect mi1 -search-dir all=. -result-dir result_memory ./a.out  # For memory investigation
inspxe-cl -collect ti1 -search-dir all=. -result-dir result_thread ./a.out  # For threading investigation
To launch the GUI version of the inspector on the login node, since inspector is an X application, you need to set up an SSH tunnel between your local PC and the login node. The procedure is the same as for the Advisor, so please refer to the relevant section.
After running the two steps with inspxe-cl, result_memory and result_thread directories are created, and inside them, there are files with the extension .inspexe. Open these files using the menu option File > Open> Result. The following screen is displayed (this is merely a sample run for demonstration purposes).